How pollution in Delhi surged on Dussehra night
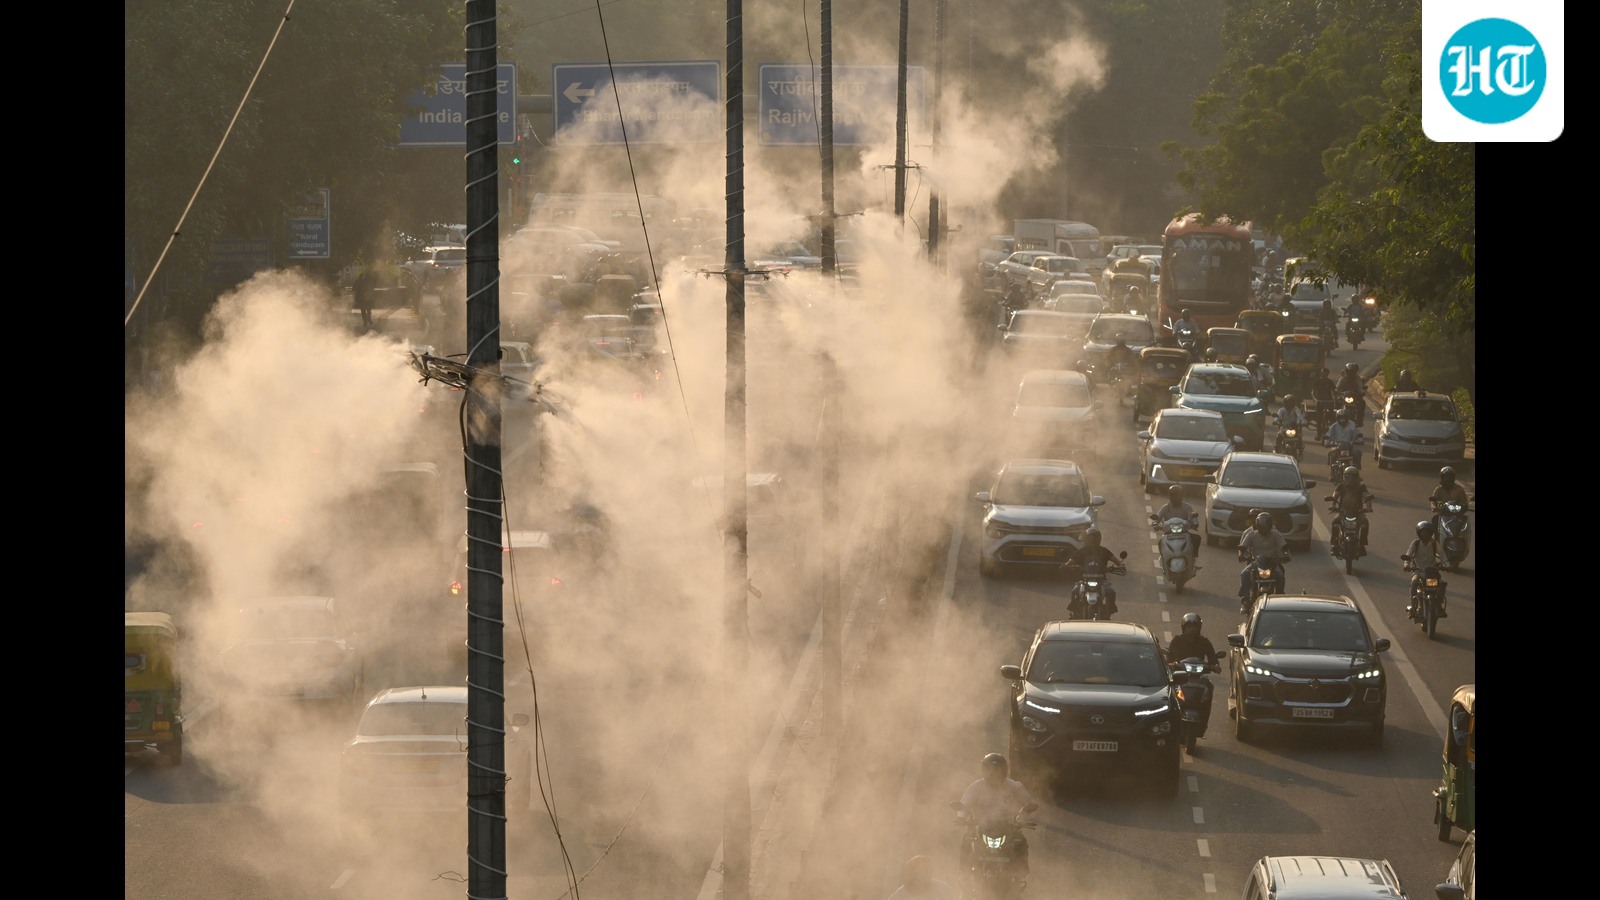
Hour-by-hour readings show the pollution level in Delhi started surging on Tuesday evening, as Dussehra effigies burned, while the two previous nights of similar weather produced no such spike.
A similar surge may come in the weeks ahead as Diwali approaches. The burning of firecrackers may be allowed more widely this year, going by the Supreme Court’s observations earlier this month.
A bench headed by Chief Justice Surya Kant said it wanted a “pragmatic and practical” way to regulate them, and warned that people would see a restrictive order as coercion. It tied the Delhi-NCR case to the national one before Justice MM Sundresh, whose bench cleared “next-generation” laris, or joint crackers, across the country on September 30.
Also Read | Green only in colour: Firecrackers flood Delhi markets amid festive season, rising AQI
What the readings showed
Because the weather changed little from the two nights before, Dussehra night gives a rough measure of what one evening of celebrations does to Delhi’s air. Delhi’s air quality index (AQI) in the Central Pollution Control Board’s (CPCB) 4pm bulletin rose from 179 on Dussehra, Tuesday October 20, to 245 on Wednesday, the season’s highest and one point below July 13’s 246; the 66-point jump was the third-largest after Dussehra since 2015.
The data cannot say how much came from the effigy burning itself, firecrackers, other fires, traffic or chemistry in the damp air, but makes evident a link between the celebrations and the surge in PM2.5 levels.
At the median of 45 long-running stations, the one-hour PM2.5 sub-index, CPCB’s 0-500 score for fine particles, was 300 or more (about 120 micrograms per cubic metre, µg/m³) for 14 hours from 10pm, peaking at 346 at 2am, when 35 of 41 stations were above 300. At the peak hour of each earlier spike this month, no more than 18 were above this level.
Between 6pm and 11pm on Tuesday, the median PM2.5 reading across the long-running stations rose by 86 µg/m³, about three times as much as on the two evenings before (29 and 27). Carbon monoxide and nitrogen dioxide, largely from traffic and other burning, rose by similar amounts on all three evenings.
From 10pm to 6am the median PM2.5 reading was 167 µg/m³, against 67 and 90 on the two nights before, while the coarse part (PM10 minus PM2.5) was 121 µg/m³, against 120 on Monday night. At the typical station, PM2.5 readings were about 58% of PM10 readings, against 41-42% on the two nights before and 29-35% in the dust-led spike that opened the month.
By 4pm on Wednesday PM2.5 was back to Tuesday afternoon’s 69 µg/m³. The 245 bulletin, a 24-hour average, records the surge that played out overnight.
All three nights had calm or near-calm surface winds, mist by 9.30pm and the strongest temperature inversions since at least October 7, with 7.6°C, 5.6°C and 7.2°C of warming aloft at 4.30am on October 19, 20 and 21. Wednesday’s inversion was lower, at about 160 metres against 240-250 m, with almost no wind beneath it.
What they suggest
The celebrations drove the surge, and the weather made it worse. Wednesday’s lower, stiller inversion accounts for only part of the jump, since calm, damp nights under strong inversions, one of them stronger than Wednesday’s, held PM2.5 at 67-90 µg/m³ on the two nights before. Nearly all the extra pollution was fine particles while traffic emissions rose about as much as on the two evenings before, which points to the effigy burnings. Crop smoke cannot on their own explain such strong jump: fire detections in Punjab and Haryana fell from 121 on October 18 to 22 on Dussehra, and the north-westerly winds that could carry it to Delhibrought no spike the two previous nights.
The reasoning
Most PM2.5 comes from burning, as smoke or as particles that form from combustion gases, while dust is mostly coarse, so a fine share that climbs while the coarse part holds steady means the extra pollution was fine particles. Carbon monoxide and nitrogen dioxide, a gauge of how much traffic exhaust the still air held, rose by similar amounts on all three evenings, while PM2.5 rose about three times as much on Tuesday, so whatever was added between 6pm and 11pm was far richer in particles than exhaust -- particularly since there would have been no evening peak hour traffic on a festival holiday.
A lower inversion squeezes a night’s emissions into less air, but packing Monday night’s 90 µg/m³ into Wednesday’s two-thirds depth gives roughly 135-140, short of 167. And that PM2.5 was back at Tuesday afternoon’s level by 4pm on Wednesday marks a one-off release, since a build-up across the region would have left Wednesday afternoon dirtier.
For figures from earlier in the month, HT converted CPCB’s index scores into concentrations using the board’s own table. Checked against CPCB’s measured values for October 18-21, the conversion was within 0.1 µg/m³ at the typical station-hour.
What the data cannot say
Besides the split between sources, the readings cannot rule out humidity making some monitors over-read particulate concentration, and damp air also speeds the conversion of gases into particulate matter. The level of PM2.5 kept rising after the burnings ended at 11pm, to about 180 µg/m³ at 2am and 3am; late burning or smoke drifting in from elsewhere in the city could explain that, though a settling inversion or damp-air chemistry may have added to it.
Nor can the data exclude a small crop-smoke share, since satellites miss fires lit between their passes. CPCB’s real-time figures are also provisional, and the board can revise them.
KioskNews shows a cleaned-up reading view extracted from the publisher’s page — the original always lives on their site, not ours.